

How to measure an AI agent: the metrics that matter
byBruno Galo · Published on 16 Nov 2025
Last updated 12 Aug 2026
Ask what an agent's automation rate is and you will usually get a confident number. Ask what happened to total process cost, error rate or cycle time and the answer is much less confident, and frequently unavailable — because nobody measured the process before the agent arrived.
This is the central measurement problem with agent deployments. The metrics that are easy to produce are the ones the agent generates about itself: how many items it processed, what proportion it handled without human involvement, its average confidence. These are inputs, not outcomes. An agent can report a high automation rate while total process cost is unchanged, because the work moved into an escalation queue that nobody counts.
The metrics that matter are the ones about the process, not the agent. They are harder to collect, require a baseline captured before deployment, and are the only basis on which anyone can honestly say whether the thing worked.
Why this matters
Measurement determines three outcomes that all arrive later than the deployment.
Whether the agent survives its first bad month. Every agent has one. If the only available evidence is an automation rate, a single visible failure dominates the conversation. If you can show cycle time down, error rate down and cost per transaction down over two quarters, one incident is contextualised rather than decisive.
Whether it improves. Improvement requires knowing which cases fail and why. A deployment measuring only aggregate automation rate has no mechanism for improvement, because the number does not decompose into anything actionable.
Whether the next one gets funded. Agent programmes are usually sequential — one process, then another. The second is funded on the evidence from the first, and "we automated 85% of matching" is a weaker case to a finance committee than a demonstrated change in cost per transaction and cycle time.
There is a converse risk worth naming. Bad measurement can also make a genuinely poor deployment look successful for long enough to be extended, which is more expensive than an honest early failure.
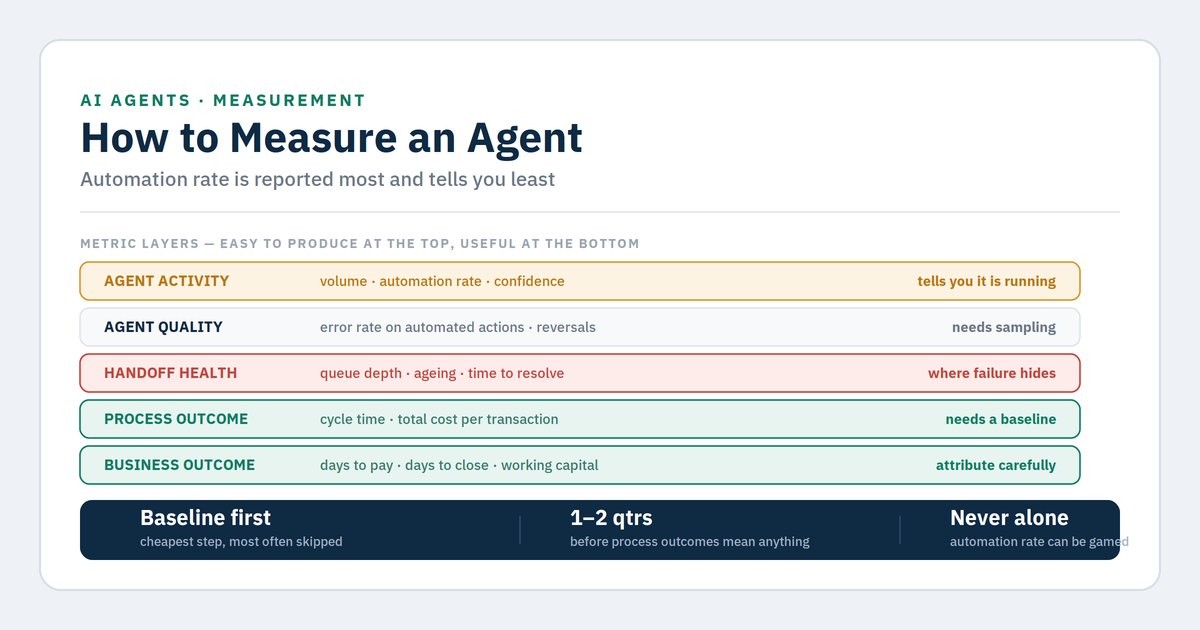
At a glance: the metric layers
| Layer | Metric | What it tells you | Trap |
|---|---|---|---|
| Agent activity | Volume processed, automation rate, average confidence | Whether the agent is running | Says nothing about whether the process improved |
| Agent quality | Error rate on automated actions, reversal rate, escalation precision | Whether autonomous decisions are correct | Requires sampling automated actions, not just reviewing escalations |
| Handoff health | Queue depth, ageing, time to resolution, proportion resolved within target | Whether relocated work is being done | Almost never instrumented at launch |
| Process outcome | End-to-end cycle time, total cost per transaction, error rate reaching customers or the ledger | Whether the deployment worked | Needs a pre-deployment baseline |
| Business outcome | Days to payment, days to close, order accuracy, working capital released | Whether it mattered | Slow-moving and multi-causal — attribute carefully |
| Learning | Proportion of escalations that could have been rules, threshold changes made, recurring exception types | Whether it will keep improving | Requires a monthly review nobody schedules |
The layer most often missing entirely is handoff health, which is precisely where a failing deployment hides. An agent with a high automation rate and a growing, ageing escalation queue has not reduced work — it has concentrated the difficult work in one place and stopped counting it.
What works, and what to be honest about
What works:
A baseline captured before anything is built. Cycle time, cost per transaction, error rate and volume for at least one full period, ideally two. This is the cheapest and most frequently skipped activity in the entire deployment, and without it every subsequent claim is an assertion.
Total cost of the process, including escalations. The honest denominator is all human time spent on the process — agent supervision, escalation resolution, monitoring, and the periodic tuning. Deployments that count only the automated portion report savings that do not appear in anyone's budget.
Sampled review of automated actions, permanently. Escalations get reviewed because they demand attention. Automated actions do not, which is exactly why errors there are found late. A small permanent sample is the only way to detect quiet degradation.
Error rate split by consequence, not just by count. Ten misclassified low-value items and one wrongly redirected supplier payment are not comparable. Weight by impact or the metric will mislead.
Escalation precision as a first-class metric. The proportion of escalations that turned out to be genuine problems. Low precision means humans are reviewing non-problems, which destroys queue attention and is invisible in every other metric.
What to be honest about:
Without a baseline, you cannot prove the value, and you probably will not get one retrospectively. Reconstructing pre-deployment cycle time from memory produces a number shaped by whoever wants the deployment to have succeeded. Accept that some benefits will be unprovable and be candid about which.
Business outcomes are multi-causal. Days to payment improved — but you also changed terms, added a customer segment and lost a slow payer. Claiming the whole improvement for the agent is the fastest way to lose credibility with a CFO. Attribute conservatively and say what else changed.
Some benefit is real and unmeasurable. Consistency, auditability, resilience to staff absence, and the removal of work people found demoralising. These matter and they do not appear in a cost metric. State them as qualitative rather than converting them into invented numbers.
Automation rate can be gamed without anyone intending to. Loosening thresholds raises it. Narrowing scope to easy cases raises it. Neither improves the process. If it is reported at all, report it alongside error rate and escalation precision so it cannot move alone.
Measurement has a cost. Instrumenting everything on this list is disproportionate for a small deployment. Pick the layers that match the stakes — agent quality, handoff health and one process outcome is a defensible minimum.
Decision framework: building the measurement
Run in order. Stop at the first match.
1. Do you have a pre-deployment baseline?
If the agent is not live yet, capture one now — one or two full periods of cycle time, cost, volume and error rate. If it is already live, reconstruct what you can, label it as an estimate, and start measuring properly from today rather than arguing about the past.
2. Are you measuring anything beyond agent activity?
If automation rate and volume are all you have, add error rate on automated actions and escalation queue depth. Those two turn a dashboard that cannot fail into one that can.
3. Is handoff health instrumented?
If not, this is the priority: queue depth, ageing, time to resolution, proportion within target. This is where a failing deployment becomes visible first.
4. Are you sampling automated actions for correctness?
If not, start a small permanent sample. Reviewing only escalations means you are checking the cases the agent already knew it was unsure about.
5. Can you state total process cost including all human time?
If not, build that number. It is the one a finance committee will ask for and the one that determines whether the next deployment is funded.
6. Do you have a monthly review categorising escalation resolutions?
If not, schedule it with a named owner. Without it the agent's performance is static from launch.
7. All of the above and the numbers look good but nobody believes them?
The issue is transparency rather than measurement. Publish the method, the caveats and what you cannot attribute. Confidence in a number comes from stated limitations more than from its size.
Indicative cost and effort
| Workstream | Typical elapsed time | Effort profile |
|---|---|---|
| Pre-deployment baseline capture | 4–8 weeks elapsed | Light effort, long elapsed — must span full periods |
| Agent activity and quality instrumentation | 2–3 weeks | Light — mostly available from the agent |
| Handoff health instrumentation | 2–4 weeks | Medium — usually requires build |
| Process cost model including escalations | 2–3 weeks | Medium — analysis, needs honest time capture |
| Sampled review process design | 1–2 weeks | Light, then ongoing |
| Reporting and dashboard | 2–4 weeks | Medium |
| Monthly learning review | 1 week setup, ongoing | Light but must be sustained |
Assumes one agent on one process with data available in the ERP or integration platform. Get a quote for a scoped estimate.
Frequently asked questions
What single metric should we report to the board?
Cost per transaction and cycle time, with error rate alongside so efficiency cannot be shown without quality. If only one, cycle time — it is harder to game and correlates with most of the benefits people actually care about.
How long before the numbers mean anything?
Agent quality and handoff health become meaningful within four to six weeks. Process outcomes need one to two quarters. Business outcomes — days to payment, days to close — typically two to three quarters, because they are slow-moving and need a clean period after the deployment settles.
Should we measure against a target or against the baseline?
Against the baseline, primarily. Targets set before deployment are guesses, and missing an arbitrary target on a deployment that materially improved the process produces the wrong conversation.
What if the agent is working but the numbers have not moved?
The usual causes are that the automated portion was not the constraint, the work moved into an uncounted escalation queue, or an upstream problem dominates. All three are findings worth having, and all three are invisible if you only measure automation rate.
Do we need a separate analytics tool?
Usually not at mid-market scale. Most of these metrics can be derived from the ERP and the integration platform's own logs. The gap is normally the process cost model and the sampled review, and neither of those is a tooling problem.
How quickly can we get the underlying data connected well enough to measure this?
Quicker than most teams assume for the plumbing — a certified partner like Stacksync can have the real-time sync feeding an agent's metrics live within weeks. The slower part is agreeing which of the metrics above actually matter for your agent before you start measuring, so you're not just producing clean numbers on the wrong things.
Closing — Next steps
The agent metric that gets reported is almost always the one the agent produces about itself, and it is the one least connected to whether the deployment was worth doing. The useful measures sit at the process level, they need a baseline, and they include the work the agent handed back.
If an agent is already running and you want to know where you stand: pull the escalation queue depth and its ageing profile, then pull total human hours spent on the process this month. Those two numbers, against whatever you know of the pre-deployment state, will tell you more than any automation rate.
About the author
Bruno Galo is the founder of Atypical Tech, a NetSuite consultancy serving mid-market clients across Iberia. He specializes in connecting CRM and ERP systems for seamless order-to-cash workflows, building automated order management pipelines that eliminate manual data entry between sales and finance teams. As an official Stacksync implementation partner, Bruno designs and deploys AI agents on integration platforms to handle exception routing, document processing, and reconciliation — turning fragmented order flows into reliable, self-monitoring systems.
LinkedIn: https://www.linkedin.com/in/brunogd
Sources
URLs are publisher-level and should be verified before publication.
- APQC, Open Standards Benchmarking — process cost and cycle time measures — https://www.apqc.org
- NIST, AI Risk Management Framework — measurement and monitoring of AI systems — https://www.nist.gov/itl/ai-risk-management-framework
- Oracle NetSuite, reporting and saved search documentation — https://docs.oracle.com/en/cloud/saas/netsuite/
- COSO, Internal Control — Integrated Framework — monitoring activities — https://www.coso.org
- Atypical Tech engagement experience, mid-market agent deployments across Iberia
- Stacksync, real-time integration and sync platform blog — https://www.stacksync.com/blog
Comments
No comments yet.
Leave a comment
Your comment will be reviewed before publishing.
Controller: Atypical Tech S.L. Purpose: to answer your enquiry. Legal basis: your consent. Rights: access, rectification, erasure and the others described in the policy, by writing to hello@atypicaltech.com.